Real-time Insights from Acumatica Dashboards for Manufacturers
Dashboards display actionable business intelligence from Acumatica data you already have. Data is nothing without powerful analytics to aggregate...
2 min read
Courtney Kubitza 9:36 AM on April 23, 2020

Everyone needs data, and in uncertain times, people with access to a company-wide view of operations can react quicker. Today, it’s even more critical to have actionable insights enabled by Acumatica data analytics software in order to take the right steps to help your business adapt to change better.
If you’re concerned about the static reports and endless spreadsheets your teams rely on to make important decisions, read more about how manufacturing, distribution, retail and construction companies like yours use Acumatica data analytics software to derive business-changing insights from the Acumatica ERP data you already have.
In most organizations, there is an overwhelming amount of data and accompanying complexity. This mountain of operational and financial data is too frequently scattered among your Acumatica ERP, CRM, and Workforce or Payroll systems. While you may be tracking the data, do you feel like you can easily see trends and opportunities that require action? Are you as the finance or accounting leader able to make decisions and deliver those reports quickly?
What if you could synchronize all your critical data together into a centralized source of truth? Phocas Software users have their data synched from Acumatica and other data sources. With its easy-to-use interface, you can drill into the data, use built-in metrics, or custom build a dashboard or report that’s easily shared with others and accessible anywhere, even if you suddenly need to work from home.
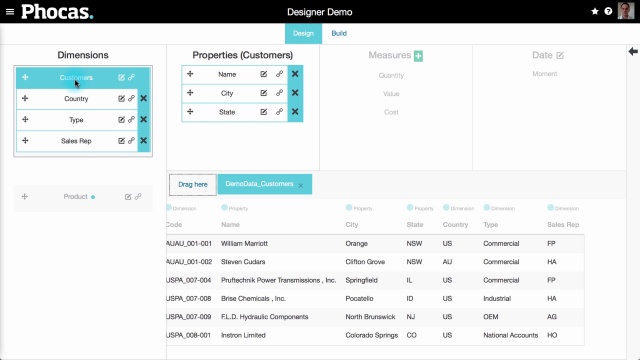
The days of waiting for IT to build your data table or query are over. With Phocas Software connected to your Acumatica ERP, you can drill down into your data to slice and dice it with a press of a button so you can easily follow a train of thought. Your decision makers can custom build queries on the fly without having to wait for your team to run their report, sparing you all those last-minute requests.
Phocas enables you to instantly dive into the data and find anything you need – at any altitude. Look at summary numbers or diver deeper into more granular, specific data. Built from the ground up to be easy to use, Phocas users can access data from day one from the top level down to the ground floor.
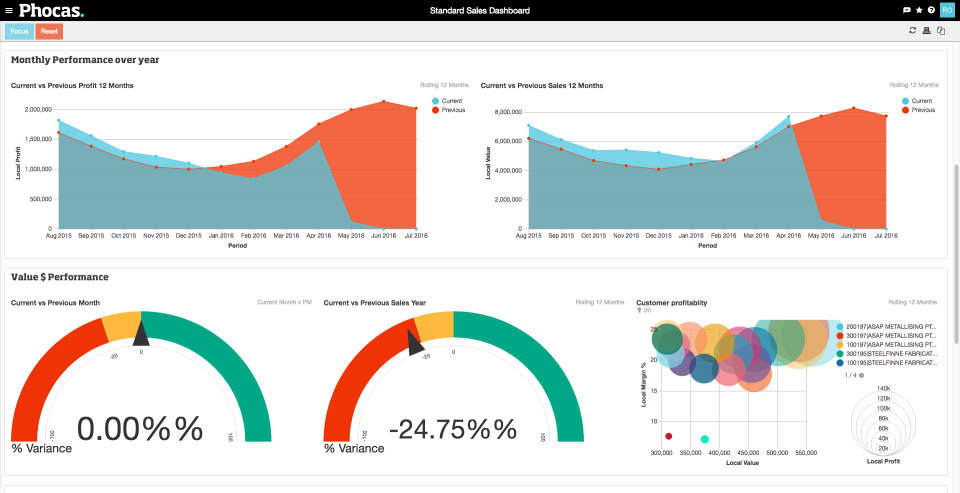
What happens a lot to companies is they end up “drowning in data, but starving for insights.” With Phocas Software, you instantly make all your flat, but complex, operational and financial data visual. You get a variety of charts and graphs, so your data makes sense and actionable insights become obvious. Choose from familiar favorites like pie charts, bar charts, and line graphs, or select from gauges, bubble charts, pareto charts, tables and waterfalls to visualize data.
From day one, Phocas users can access tracking and reporting on essential KPIs or metrics that are specific to their role and your industry. And because your business processes aren’t cookie cutter, we made sure your data visualization isn’t either. With a flexible platform, you can easily customize your dashboards and reports and answer critical questions such as “why are sales trending down?” or “what’s my best moving inventory?”
If you’d like to get business-changing insights from the Acumatica data at your fingertips, contact the Acumatica experts at Phocas Software today to request your 30-minute demo.

Dashboards display actionable business intelligence from Acumatica data you already have. Data is nothing without powerful analytics to aggregate...

Real-time data-driven decisions enabled by Acumatica analytics. The struggle for profitability is real! Today's market is more uncertain than ever...

What Successful Companies are Turning to in 2021 As we reflect on the unexpected chaos that 2020 presented, we also look ahead at ways of adapting to...