See What's Happening With Acumatica Manufacturing Software
How manufacturers use Acumatica Manufacturing Software to predict success. Finance leaders at successful manufacturers often have one thing in...
2 min read
Adam Rice 9:42 AM on August 17, 2021

In the never-ending search for more ways to create efficiency, increase customer satisfaction, and become a truly data-driven organization, it is important not to overlook your dashboards. If you don't have access to real-time, visual dashboards that are shared across your entire organization, you could be missing out on these three benefits of implementing manufacturing data visualization software.
The best way to accelerate success is to repeat what is working. It can be intimidating to consider the sea of data you would need to analyze and cross-reference to understand what's working across your business, or across multiple locations. By transforming Precoat’s IBM data into dynamic dashboards, their managers and executives are able to actually interact with real-time data and make data-driven decisions by drilling down on metrics of concern.
The team at Precoat has been able to standardize their metrics for every plant utilizing iDashboards data visualization software to help them quickly discover problem areas and surface the root cause and cascading impacts. Their new dashboards have enabled Precoat to improve and adopt best practices which have resulted in better time utilization for their plant managers.
Precoat's teams now save approximately 16 hours each month per plant by automating data collection and the dashboard chart building process. With these savings, Precoat has reallocated resources to focus on improving operating efficiencies throughout the organization. Precoat has developed dozens of dashboards to support their entire organization, including:
EMI has seen a complete transformation in the way they do business. With the availability of real-time data to employees at all levels, they are alerted to issues and course-correct quickly. This agility has enabled them to increase revenue, decrease waste and error, and reduce strain on personnel.
And for EMI’s employees who work without access to computers, they utilize wall displays throughout their manufacturing floor. Employees at every level can see the metrics that matter to their job function. That transparency leads to enhanced accountability. According to Dave Maschke, General Manager at EMI, having the Wall Displays in workspaces is “like looking at their scorecard. They can quickly assess, ‘Did we win yesterday? Do we need to do something different today?’”
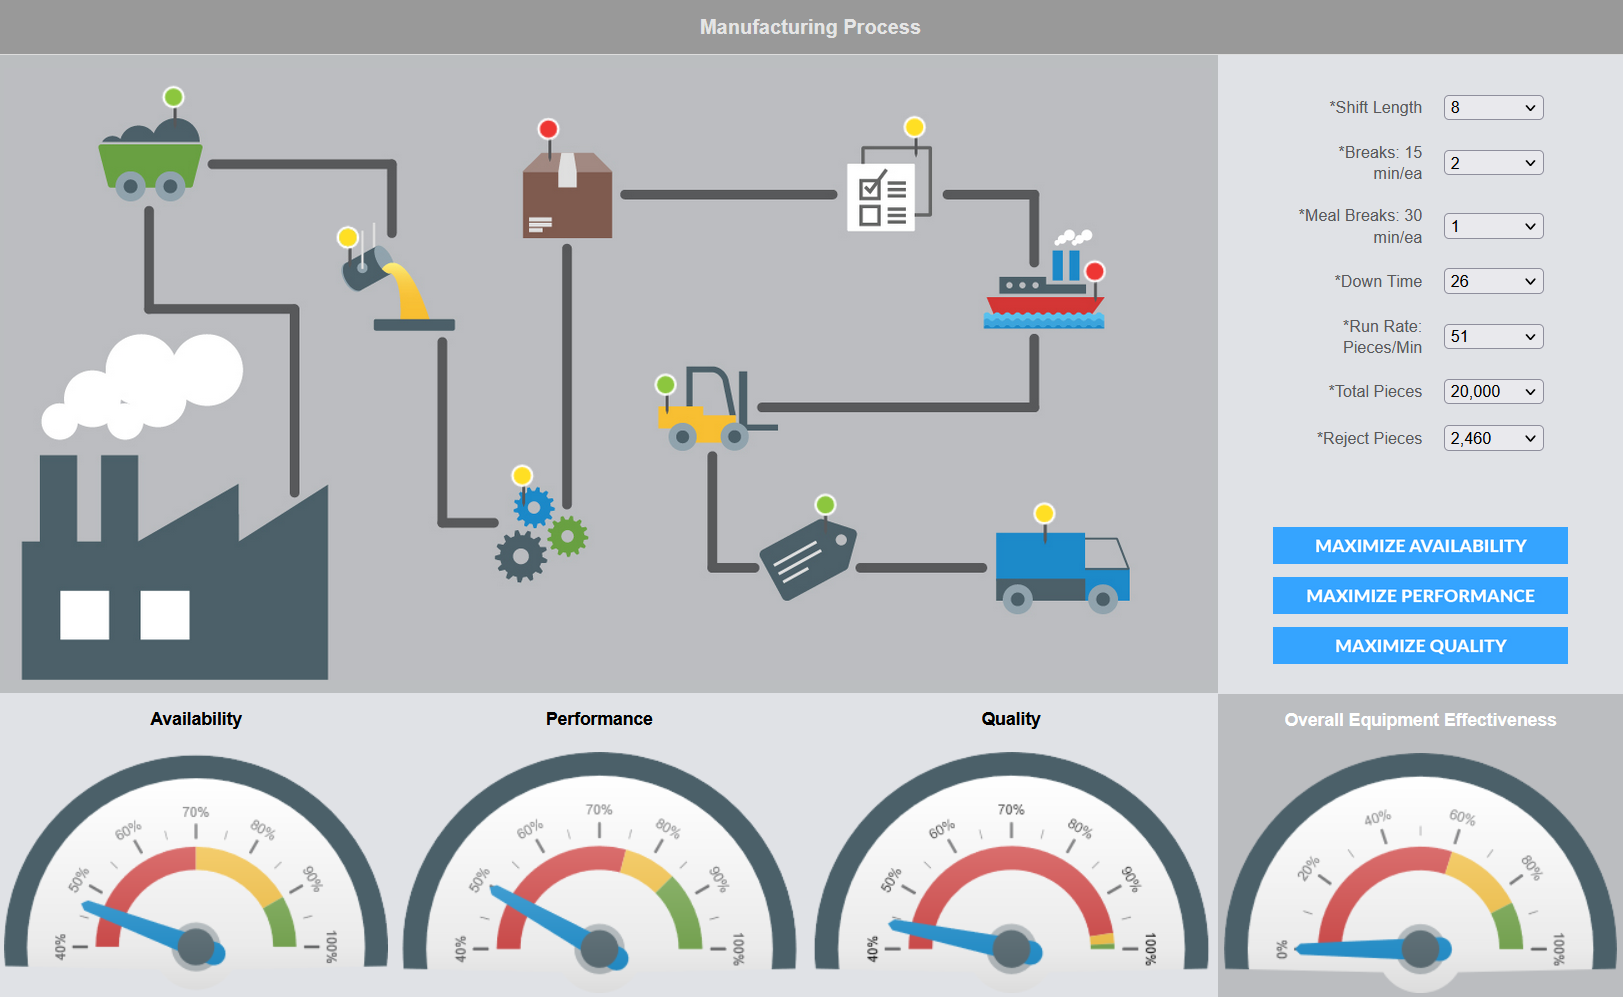
Vigilant plant managers who seek to maximize availability, performance, and quality obtain a lot of useful insights via a manufacturing plant dashboard. What you can't see in Excel spreadsheets is very obvious on iDashboard's interactive infographic on the manufacturing dashboard seen below. The example illustrates the real-time data for each phase of manufacturing. The journey is clearly outlined, and users can drill down at any point to see the availability, performance, quality, and overall equipment effectiveness. Plant managers can easily and efficiently receive data that will help them reach their goals for optimal operations.
 At iDashboards, we have helped companies just like yours with our proven, Our 4-Step Proven Success Plan. We collaborate with you to define the dashboard stakeholders, identify the data sources and metrics, storyboard your dashboards, and guide you to a successful go-live. Contact us today, call 888-359-0500 or email.

How manufacturers use Acumatica Manufacturing Software to predict success. Finance leaders at successful manufacturers often have one thing in...

1 min read
Acumatica Manufacturing Lunch and Learn Live Webinar "Six Integrated Manufacturing Tools that Will Make You HOWL" Who ever said "there's no such...

3 Ways Unified Data for Manufacturing Companies Help Improve Service Delivery and Profits Manufacturing companies are faced with more demands by...