Increase Cash Flow with Sage Enterprise Intelligence
Satellite Industries, Inc. had challenges with a time-consuming and difficult financial reporting process, but with a quick implementation of Sage...

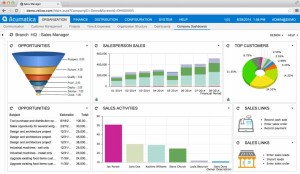
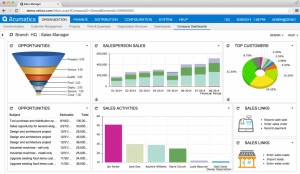
 Gartner’s survey on Financial Executive International CFO Technology said that ERP software dashboards are said to be one of the top priorities related to software investments that executives are seeking. They allow quick and easy insight into important data to make valuable business decisions. NexTec Group knows that dashboards deliver exactly what executives are looking for:scorecards, graphs and charts that showcase trajectories, opportunities, and challenges through data and key performance indicators (KPIs). This helps to best manage projects, departments, divisions or even your entire Professional Services organization.
Dashboards have been delivering information for years, like checking how much gas you have in the tank, monitoring your credit card expenses, or even reviewing the activity analysis of your Google account. Business Intelligence (BI) data visualization tool allows access to data trend insights just as the daily life examples do enabling quick and informed decisions for your Professional Services organization. BI dashboards include interactive and adaptable analytical features that are customizable in nature, so you can clearly understand the health of your company. Most BI dashboards come with drill-down and drill-to functionality built right into the product, so you can look at specific target data to make better decisions. Now that we’ve made it clear why data visualizations are so prevalent in the business world, let’s zoom in on the features and functionalities that can upgrade your Acumatica processes into more accessible, dynamic dashboards.
Data visualizations allows analysis of data from multiple sources. If you require a real-time view, particularly for financials, you can use the native Acumatica dashboard functionality. Live analytics are preferred for professionals who need up-to-date financials – or smaller organizations that are happy with basic accounting system data visualizations, without the resources to maintain a BI data store, like a data warehouse or an online analytical processing (OLAP) cube. On the other hand, larger Professional Services organizations usually need more than just financial information – and a quicker, more powerful performance for their dashboards – which can be challenging to achieve with a live Acumatica data visualization.
BI data store integrations enable bigger Professional Services companies to produce operational and financial data visualizations without slowing down the Acumatica server when querying data for real-time analyses. If your team has several Acumatica users who might be pulling data that is a substantial amount or even simultaneously, a BI data store usually delivers a higher performance. You will first have to replicate your data to the cube or warehouse, but it will likely still be faster, depending on the size of your data query. One of NexTec Group’s favorite aspects of a BI data store is that you can store other types of data in one space, such as clients, projects, consultants, types of service, etc. Some third party software vendors also focus on flexibility and hybridity when building their software, so you can choose how you’d like to integrate your data.
To continue learning more about Acumatica dashboards for Professional Services, read the rest of this article here.
- See more at:

Satellite Industries, Inc. had challenges with a time-consuming and difficult financial reporting process, but with a quick implementation of Sage...

Cloud ERP Consultants Review the Power of the Portal Most people don’t generally start out looking for and ERP solution—they start by considering...

Executives justify moving to a standard Enterprise Resource Planning (ERP) solution based on a number of compelling reasons. By supporting a single...